 Jobboy
Introduction
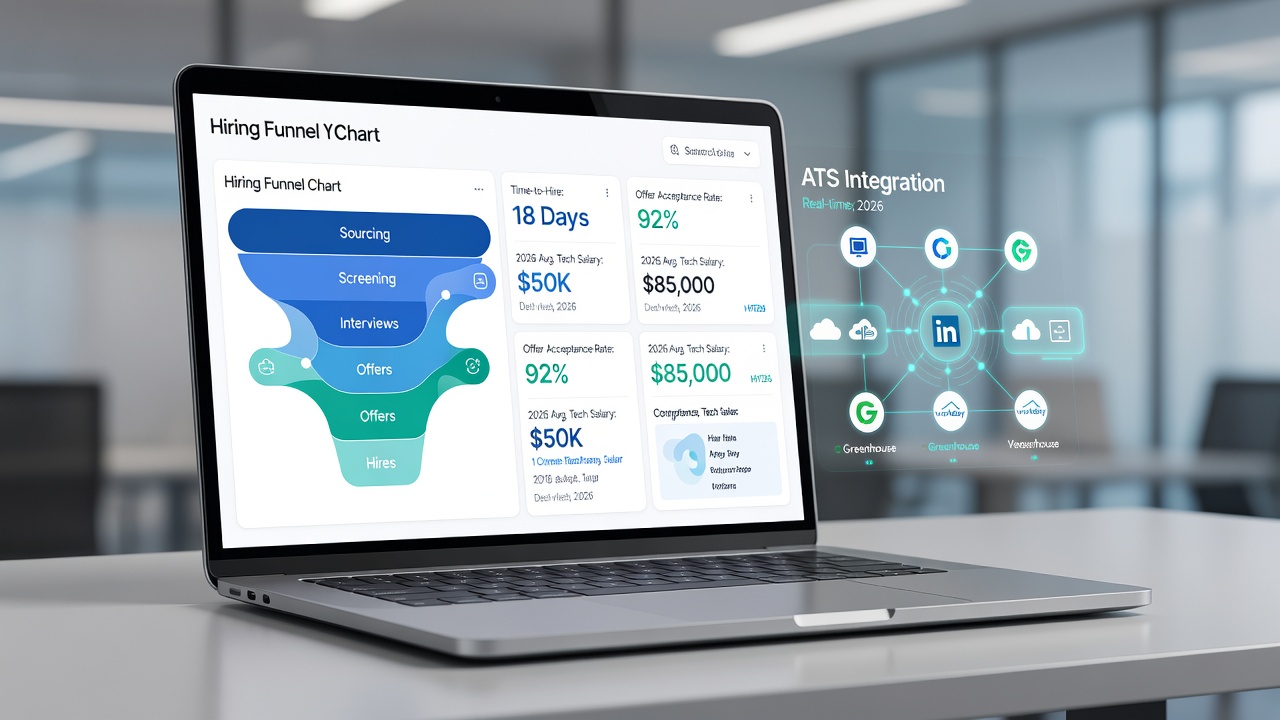
In 2026, data-driven hiring has become essential for recruiters aiming to reduce time-to-hire and improve candidate quality. Custom recruiting dashboards provide a centralized view of hiring funnels, enabling teams to monitor performance in real time and make informed decisions quickly. This comprehensive guide explains how to build these dashboards from scratch, covering data sources, integrations, KPI selection, visualization techniques, and maintenance strategies. Whether you are a solo recruiter or part of a large talent acquisition team, understanding these elements can transform your hiring process into a streamlined, measurable operation that aligns with organizational goals.
Why Custom Recruiting Dashboards Matter in 2026
Standard reports from applicant tracking systems often fall short when teams need deeper insights into complex hiring pipelines. Custom dashboards allow recruiters to combine multiple data streams and visualize trends that matter most, such as emerging bottlenecks or underperforming channels. Organizations that adopt tailored solutions report faster decision-making and better alignment between recruiting and business goals. In today's competitive talent market, relying on generic metrics can lead to missed opportunities, while custom views highlight actionable patterns that drive efficiency and diversity in hiring outcomes.
Essential Data Sources and ATS Integrations
Effective dashboards pull data from several sources to create a holistic view. Primary inputs include your ATS, job boards, HRIS platforms, and even external labor market data. Popular ATS tools like Workday, Greenhouse, and Lever offer APIs for seamless integration. Connect these via middleware such as Zapier or native connectors in visualization software. Always validate data mapping to prevent duplication or missing records during the import process. Additional sources worth incorporating are employee referral platforms, assessment tool outputs, and calendar scheduling data. This multi-source approach creates a complete picture of the candidate journey from application to onboarding. For example, integrating referral data with ATS records can reveal which internal programs yield the highest retention rates after hire. When setting up connections, start with authentication protocols like OAuth 2.0 to ensure secure data flow, then test small batches before scaling to full datasets.
Selecting KPIs Beyond Basic Metrics
Move past simple metrics like number of applications or hires. Focus on advanced KPIs such as quality of hire scores, offer acceptance rates by source, diversity funnel conversion, and recruiter workload balance. Time-to-fill segmented by role type and department reveals bottlenecks more accurately than aggregate averages. Consider these key performance indicators in your dashboard design:
- Quality of hire measured through 90-day performance ratings and manager feedback scores
- Stage conversion rates across the full funnel, including application to interview and interview to offer
- Cost per hire adjusted for role seniority and including advertising plus recruiter time
- Recruiter productivity measured in interviews conducted per week and offers extended
- Diversity metrics tracking representation at each funnel stage to support inclusive hiring goals
- Predictive indicators like candidate drop-off likelihood based on historical patterns
These metrics provide a nuanced understanding that basic counts cannot deliver, helping teams prioritize efforts where they impact results most.
Visualization Best Practices Using Tableau or Power BI
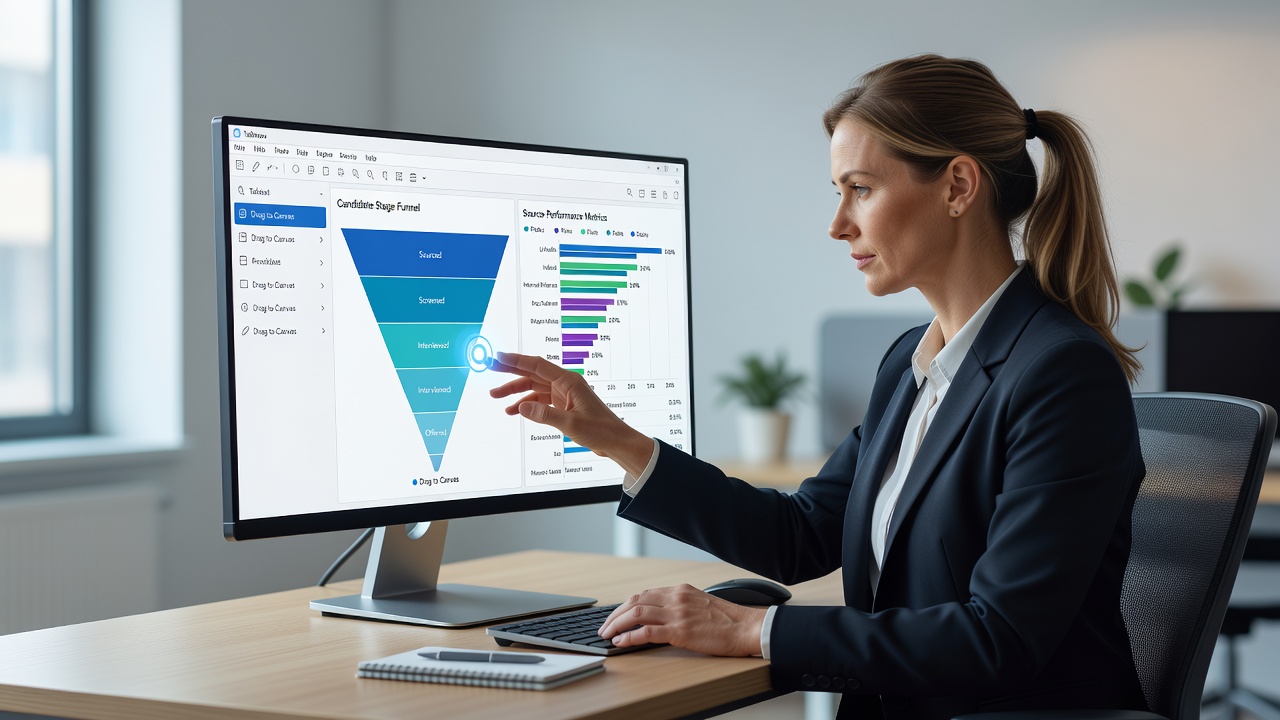
Both Tableau and Power BI excel at turning raw recruiting data into actionable visuals. Use funnel charts to display stage progression and heat maps to highlight sourcing channel effectiveness. Apply consistent color coding—green for positive trends and red for delays—to improve readability across the team. Interactive filters let users drill down by location, role, or time period without needing technical expertise. Limit each dashboard page to five to seven visuals to avoid overwhelming viewers and maintain focus on critical insights. Tableau and Power BI both support scheduled refreshes, keeping data current without manual intervention. Additional best practices include using tooltips for detailed explanations on hover and embedding calculated fields directly in charts for dynamic updates as new data arrives.
Step-by-Step Setup Instructions
Begin by exporting sample data from your ATS in CSV or API format. Import it into your chosen tool and create calculated fields for custom KPIs using formulas that match your organization's definitions. Build the initial layout starting with a summary overview page that includes high-level cards for active requisitions and open roles. Then add detailed funnel and source analysis pages with drill-down capabilities. Test with sample users from the recruiting team and refine based on feedback before full rollout. Document each step, including data refresh schedules and user permissions, to ensure long-term maintainability. For advanced users, incorporate row-level security so that individual recruiters only see data relevant to their assigned positions.
Real-World Examples of Dashboards That Cut Time-to-Hire
One mid-sized tech company reduced average time-to-hire by implementing a dashboard that flagged stalled candidates in the interview stage and triggered automated reminders. Another organization used source effectiveness visuals to shift budget toward high-performing channels, improving offer acceptance rates within one quarter. A third example comes from a healthcare provider that layered diversity metrics onto their funnel view, allowing them to adjust sourcing strategies and achieve more balanced shortlists without extending overall timelines. These cases demonstrate how visual clarity turns data into immediate process improvements.
Free Versus Paid Solutions Comparison
Free options such as Google Data Studio or basic Power BI desktop versions suit small teams with limited data volumes and simple reporting needs. Paid platforms provide advanced collaboration features, row-level security, dedicated support, and scalability for enterprise environments. Evaluate based on team size, data complexity, and need for real-time updates rather than upfront cost alone. Many organizations start with free tiers to prototype their dashboards and then migrate to paid versions once usage patterns and requirements become clear.
Common Pitfalls to Avoid
Many teams overload dashboards with too many metrics, leading to analysis paralysis and reduced adoption. Others neglect data governance, resulting in inconsistent or outdated information that erodes trust in the tool. Always establish clear ownership for data quality and schedule regular audits every month. Additional pitfalls include ignoring mobile responsiveness, which limits access for hiring managers on the go, and failing to train users on interpreting visuals correctly. Address these by conducting quarterly reviews and incorporating user feedback loops into your maintenance routine.
FAQ: Maintaining Data Accuracy in 2026
How often should dashboards refresh?
Daily refreshes work well for most recruiting teams, while high-volume environments may benefit from hourly updates during peak hiring seasons.
What steps ensure data integrity across sources?
Implement validation rules during import and maintain a data dictionary that documents every field mapping and transformation applied.
Can dashboards handle compliance requirements?
Yes, when built with proper access controls, audit logs, and encryption that meet current privacy regulations such as GDPR and CCPA.
How do you handle missing or incomplete data from integrations?
Use automated alerts for data gaps and create fallback calculated fields that flag incomplete records for manual review by the team.
Conclusion
Building custom recruiting dashboards transforms hiring from reactive to proactive. By focusing on the right data sources, KPIs, and visualization practices, recruiters can deliver measurable improvements in 2026 and beyond while fostering a culture of continuous optimization.

No comments yet. Be the first!