 Jobboy

Introduction to Predictive Analytics for Job Seekers in 2026
In today's competitive job market, waiting for postings to appear often means missing out on prime opportunities. Predictive analytics empowers job seekers to anticipate demand using public labor statistics and accessible AI tools. This approach extends big data concepts into practical career strategy, helping you identify roles with strong growth potential weeks or even months ahead. By analyzing trends from official sources, you can position yourself for early outreach, networking, and skill alignment. This article provides a complete guide to setting up simple models, validating forecasts, and applying insights ethically. Job seekers who master these techniques gain a significant advantage, turning data into actionable career moves rather than reacting to live postings.
Accessing Public Labor Data Sources
Start with reliable government APIs for accurate, up-to-date information. The Bureau of Labor Statistics offers datasets on employment projections, occupational outlooks, and industry trends. Similarly, Data.gov aggregates labor market information from multiple federal agencies. Another valuable resource is the O*NET Online database, which provides detailed occupational data including skills requirements and growth forecasts. Key metrics include projected job growth rates, median salaries by occupation, and regional demand variations. Download CSV files or query APIs directly for automation. For 2026 modeling, focus on quarterly releases to capture emerging shifts in sectors like technology, healthcare, and green energy. Cross-reference multiple sources to improve reliability and reduce bias from any single dataset.
Step-by-Step Setup of Simple Predictive Models
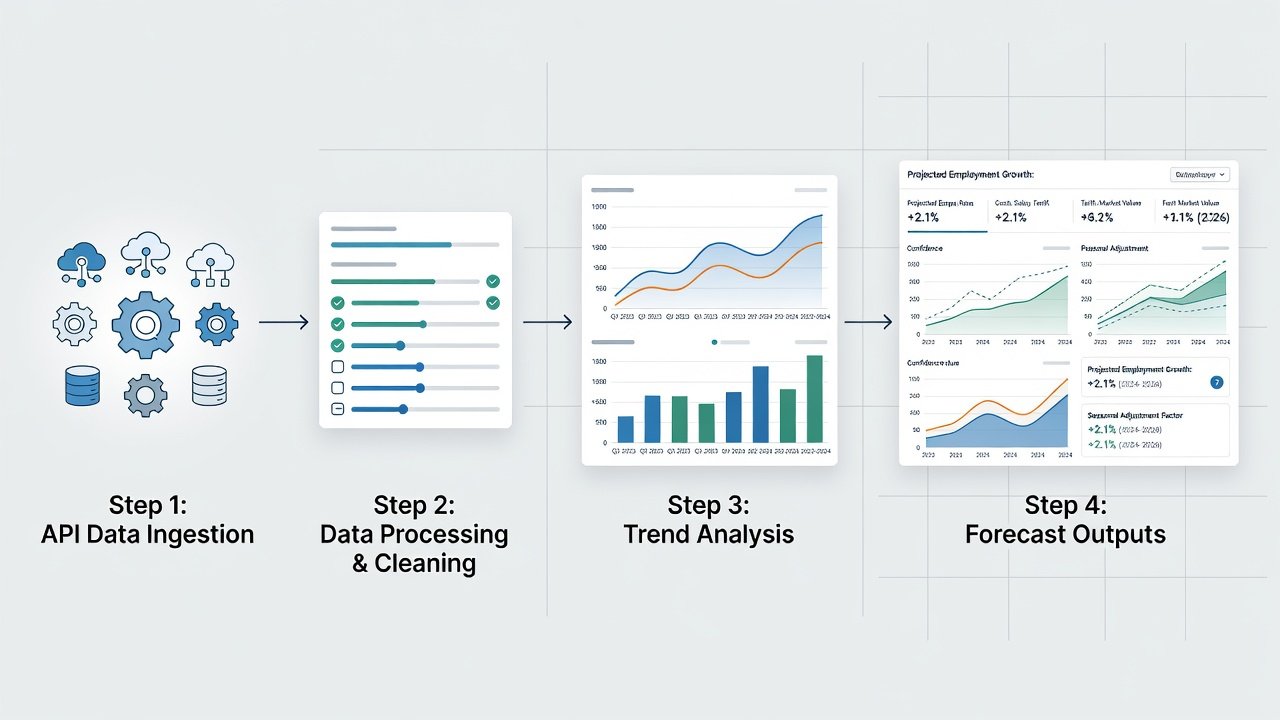
Building a basic model requires no advanced coding expertise. Use free tools like Python with libraries such as Pandas and Scikit-learn, or no-code platforms integrated with AI assistants. Begin by identifying target occupations based on your background. Next, collect historical data from BLS APIs covering the past 3-5 years. Preprocess data by cleaning missing values and normalizing growth percentages. Apply simple regression or time-series forecasting to project future demand. Incorporate external signals like economic indicators for improved accuracy. Many seekers begin with spreadsheet-based models before scaling to AI-enhanced versions. Test on roles like data analysts or renewable energy technicians to refine your approach. Document each step so you can replicate and adjust the model as new data arrives. Free AI tools such as Google Colab notebooks can automate parts of this process without requiring local installations.
- Define your target roles and time horizon for predictions.
- Extract raw data files from public APIs and store them locally.
- Clean and transform the dataset using basic scripts or spreadsheet functions.
- Run forecasting algorithms and generate initial projections.
- Validate outputs against recent actual posting volumes from job boards.
Repeat this cycle monthly to keep forecasts current and relevant.
Trend Visualization Examples and Techniques
Visuals make forecasts actionable. Plot line charts showing year-over-year growth alongside bar graphs comparing industries. Tools like free versions of Tableau Public or Google Data Studio help create interactive dashboards. For instance, a visualization might reveal a 15% projected rise in AI ethics roles based on recent BLS patterns. Overlay Google Trends data to confirm rising search interest in related skills. Heat maps can highlight regional hotspots, while scatter plots show correlations between education levels and job growth. These visuals help you quickly communicate findings during networking or interviews. Experiment with color coding to emphasize high-opportunity areas and declining sectors to avoid.
Metrics for Validating Your Predictions
Track accuracy using metrics such as mean absolute error between predicted and actual job postings. Compare your forecasts against real outcomes from job boards over 4-6 weeks. Aim for at least 70% alignment in high-growth categories to build confidence. Additional useful measures include precision at different thresholds and recall rates for top predicted roles. Adjust models quarterly using new labor releases. Keep a simple log of prediction versus outcome to identify patterns where your model consistently underperforms or overperforms. This iterative validation process turns raw data into trustworthy guidance for your job search strategy.
Case Studies of Early Outreach Success
One software engineer used 2025 data to predict demand in sustainable tech, reaching out to companies three weeks before roles posted and securing two interviews. Another marketing professional forecasted growth in e-commerce personalization, landing a role by networking with targeted firms based on regional statistics. A third example involves a recent graduate who analyzed healthcare data analytics trends and contacted hiring managers at regional hospitals, resulting in an informational interview that led to a formal application before the position was publicly advertised. These examples highlight how proactive application of forecasts accelerates hiring pipelines and reduces competition. Success often depends on combining data insights with personalized outreach messages that reference specific growth trends.
Comparing Google Trends and Specialized Platforms
Google Trends provides free, real-time search volume insights but lacks depth in occupational specifics. Specialized platforms offer labor-focused forecasting with API integrations but may require learning curves. For beginners, start with Trends to validate interest spikes, then layer in BLS data for precision. Hybrid approaches often yield the best results for 2026 job hunting. Consider pros such as ease of use for Google Trends versus deeper occupational detail from dedicated labor platforms. Test both on the same set of roles to see which signals align best with actual hiring activity in your field.
Ethical Data Use and Common Errors to Avoid
Always cite public sources and respect privacy when analyzing aggregated data. Avoid over-relying on single indicators or ignoring economic context, which can lead to false positives. Common mistakes include neglecting regional variations and failing to update models with fresh data releases. Maintain transparency in your outreach to build trust with potential employers. Another frequent error is treating predictions as certainties rather than probabilities; always communicate forecasts as directional guidance. Finally, ensure your models do not inadvertently reinforce biases present in historical labor data by regularly reviewing outputs for fairness across demographics and regions.
Integrating Free AI Tools for Enhanced Forecasting
Free AI assistants can help interpret complex datasets and suggest refinements to your models. Upload cleaned labor data to platforms that support natural language queries to generate summary insights or alternative forecasting approaches. Combine these outputs with your manual analysis for more robust results. This integration saves time while improving the sophistication of simple models without incurring costs.
Frequently Asked Questions
How can I scale predictions across industries?
Segment your model by sector using BLS industry codes. Run parallel forecasts for tech, healthcare, and finance, then prioritize based on your skills and location preferences. Update segments independently as new quarterly data becomes available.
What about different career levels?
Entry-level roles benefit from broad growth trends, while senior positions require niche metrics like leadership demand. Customize inputs accordingly for targeted accuracy and include experience-level filters when available in the source data.
Are free AI tools sufficient for robust models?
Yes, combining public APIs with accessible machine learning interfaces delivers reliable results for most job seekers without paid subscriptions. Start simple and add complexity only when basic models demonstrate consistent accuracy.
How often should I refresh my data and models?
Refresh data with each major BLS or O*NET release, typically quarterly, and re-run models monthly to incorporate the latest signals while maintaining stability in your forecasts.
Conclusion
Mastering predictive analytics in 2026 transforms passive job searching into strategic opportunity hunting. By leveraging public data and free tools, you gain a competitive edge through timely, informed actions. Begin with small models today and iterate based on real-world results to advance your career proactively.
No comments yet. Be the first!