 Jobboy

Introduction: Why Dashboards Matter for Freelancers in 2026
Remote freelancers often juggle income from multiple platforms, clients, and project types, making it difficult to see the full picture of profitability. A well-designed dashboard transforms scattered data into actionable insights, revealing which services generate the highest returns and where time is being wasted. In 2026, as remote work continues to evolve, freelancers who leverage data analytics gain a competitive edge by optimizing their portfolios and scaling sustainably. This comprehensive guide covers everything from selecting tools to automating imports and interpreting results, ensuring you can build a system that grows with your business.
Choosing the Right Tools for Dashboard Creation
Selecting accessible tools is the foundation of an effective dashboard. Google Sheets provides free, collaborative access with built-in charts and formulas, making it suitable for most freelancers starting out. Microsoft Excel offers robust pivot tables and offline functionality for those handling larger datasets. Airtable stands out for its database-like structure that links clients, projects, and invoices seamlessly. Consider your current workflow: if you need real-time team access, start with Google Sheets. For advanced calculations without internet, Excel is preferable. Airtable bridges the gap when relational data becomes essential.
Key Metrics to Include in Your Freelance Dashboard
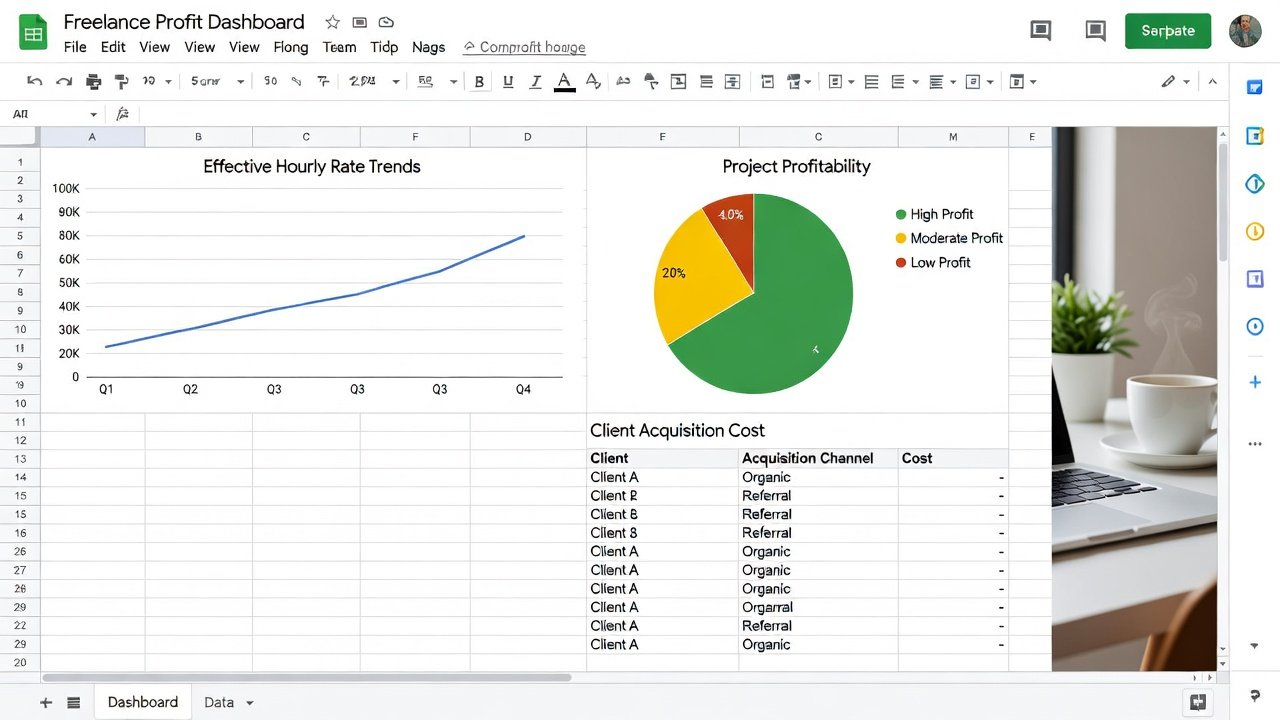
Beyond basic revenue tracking, focus on metrics that highlight true profitability. Effective hourly rate measures earnings per hour after accounting for all time spent. Client acquisition cost tracks the resources used to win new business, including proposal writing and networking. Project profitability subtracts direct expenses such as tools or subcontractors from revenue. Additional metrics include monthly trend lines for recurring income, service category breakdowns, and utilization rates showing billable versus non-billable hours. These figures help pinpoint underperforming areas quickly. For example, a client paying high fees might still drag down overall earnings if the hourly rate falls short of your target after expenses.
- Track effective hourly rates across all active projects.
- Calculate acquisition costs by logging time spent on outreach.
- Monitor profitability ratios to compare service types.
- Review trends weekly to catch seasonal dips early.
Step-by-Step Setup Guide
Begin by setting up a central data repository. Create columns for date, client name, project description, hours logged, gross revenue, direct costs, and platform source. Import historical data from CSV exports provided by major platforms. Use simple formulas such as revenue divided by hours to auto-calculate hourly rates. Next, organize data into separate tabs for clients, projects, and summaries. Build visualizations by inserting bar charts for revenue by client and line graphs for monthly trends. Apply conditional formatting to flag rates below your minimum threshold. In Airtable, create custom views and summary fields for instant overviews. Test the dashboard with sample data before committing real records.
Integrating Time Tracking and Platform Data
Accurate time logging is critical. Integrate apps like Toggl or Harvest that export directly to your chosen tool. For platforms such as Upwork and Fiverr, schedule regular CSV downloads or use API connections where supported. This automation reduces manual errors and keeps metrics current. Set up weekly imports so your dashboard always reflects the latest activity without extra effort.
Real-World Examples of Income Doubling
Consider a freelance writer who discovered through dashboard analysis that blog posts paid far less per hour than white paper projects. By reallocating time toward higher-value work and declining low-rate gigs, income doubled within eight months. Another example involves a web developer who tracked client acquisition costs and realized LinkedIn outreach was far more efficient than platform proposals. Shifting focus reduced unpaid hours dramatically and increased net profits by identifying the most responsive channels. These cases illustrate how visibility into metrics drives strategic pivots.
Free vs Premium Visualization Options
Free versions of Google Sheets and Excel deliver sufficient charting and formula power for most solo freelancers. Premium options unlock advanced features such as automated reporting in Excel via Power Query or Airtable's expanded automation and interface builders. Evaluate based on volume: begin with free tiers and upgrade only when data complexity or team collaboration requires it. Many freelancers find the free tier adequate for years.
Automating Data Pulls from Platforms
Reduce manual work by connecting to Upwork and Fiverr through exports or third-party connectors. Services like Zapier enable scheduled syncs that pull earnings and hours directly into your sheet. This approach minimizes human error and ensures your dashboard stays updated without daily intervention. For Airtable users, native integrations further streamline the process.
Avoiding Common Tracking Errors
Many freelancers stumble on inconsistent logging or overlooking non-billable activities. Always record every hour spent, categorize expenses precisely, and reconcile imports weekly to catch duplicates. Another frequent issue is failing to update target rates as skills improve. Review your minimum hourly threshold quarterly and adjust dashboard alerts accordingly. Accurate categorization prevents skewed profitability reports that could lead to poor decisions.
Interpreting Data and Making Decisions
Once data flows into the dashboard, analyze patterns monthly. Look for clients with rising acquisition costs or declining hourly returns. Use these insights to negotiate rate increases, drop unprofitable services, or expand successful offerings. Share summary views with accountants during tax season for smoother filings.
Actionable Templates and Scaling Tips
Start with a basic template containing revenue, hours, and calculated rates. As your freelance income grows, add layers such as predictive forecasting and multi-year comparisons. Scale by creating separate dashboards for different income streams and setting automated alerts for key thresholds. Regular audits ensure the system remains relevant.
FAQ: Scaling Your Tracking Systems
How often should I update my dashboard? Weekly manual reviews paired with daily automated imports keep information fresh without overwhelming effort.
What if my income spans multiple currencies? Incorporate conversion formulas linked to live exchange rates for consistent comparisons across borders.
Can I integrate with accounting software? Export summarized data to popular tools for seamless tax and expense management.
How do I handle project-based versus retainer income? Separate tabs or views allow distinct tracking while maintaining an overall profitability overview.
When should I consider hiring help to maintain the system? Once monthly data entry exceeds a few hours, explore delegation or advanced automation.

No comments yet. Be the first!