 Jobboy

Introduction: Why Build Your Own Job Predictor in 2026
Job seekers in 2026 face a dynamic market where anticipating openings can provide a significant edge. By combining free public data from the Bureau of Labor Statistics (BLS), AI analytics tools, and real-time keyword trends from job boards, anyone can create a simple yet powerful predictor. This guide walks through a repeatable process to forecast high-growth roles weeks in advance using accessible tools like spreadsheets or no-code platforms. The method focuses on actionable tactics that help users stay ahead of hiring cycles in competitive fields.
Traditional job searching often reacts to posted openings, but predictive approaches shift the timeline. With unemployment rates fluctuating and industries evolving rapidly due to technology and policy changes, having a personal forecasting system reduces application volume while increasing relevance. This article covers every component needed for implementation, from data sourcing to accuracy tracking, ensuring readers can replicate results consistently.
Accessing and Understanding Free BLS Labor Data
The Bureau of Labor Statistics serves as the primary free source for labor market intelligence. Its Employment Projections program releases detailed tables every two years covering hundreds of occupations, including numeric and percent changes in employment. Users can download files directly from the BLS website covering national and regional breakdowns. Key tables include occupational employment and wage statistics updated monthly.
Beyond raw numbers, the Occupational Outlook Handbook provides narrative summaries on job duties, required education, and advancement opportunities. For 2026 planning, focus on sectors like renewable energy, healthcare support, and data analysis where projections indicate sustained demand. Cross-reference with the O*NET Online database maintained by the U.S. Department of Labor for detailed skill requirements that complement BLS growth figures. This layered approach reveals not just which roles will grow but why they matter for long-term career planning.
Step-by-Step Setup of a Simple Spreadsheet Dashboard
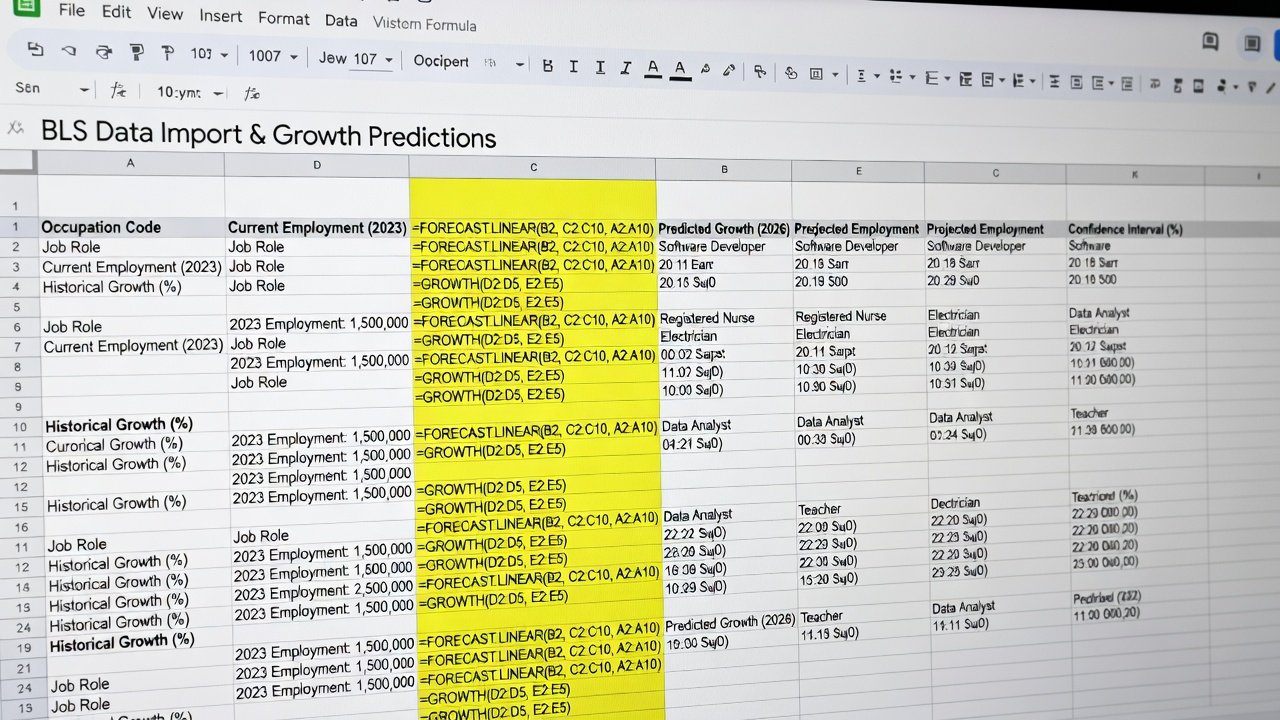
Creating the core dashboard starts with a blank Google Sheets file or Excel workbook. Label the first tab "BLS Raw Data" and paste downloaded CSV content into columns A through F covering occupation code, title, 2023 employment, 2033 projection, percent change, and numeric change. Use the QUERY function or FILTER to pull only roles with positive growth above a chosen threshold such as 8 percent.
The second tab labeled "Trends Input" captures weekly keyword volumes from job boards. Enter sample data for terms like "sustainability manager" or "machine learning engineer" alongside dates. Formulas in the third tab calculate a composite score by multiplying BLS growth by a normalized trend factor derived from search volume increases. Conditional formatting rules automatically color-code high-potential entries in green when scores exceed 75.
Advanced users can add a fourth tab for historical logging to compare past predictions against actual postings. Include dropdown menus for industry filters and a summary dashboard view using pivot tables that aggregate average lead times. This structure remains fully functional without paid add-ons while allowing easy expansion as new data arrives.
Incorporating AI Analytics Tools for Deeper Insights
Free AI integrations accelerate pattern recognition within the collected data. Google Sheets now offers built-in Explore features that generate charts and suggested formulas automatically. For more sophisticated analysis, connect sheets to large language models through browser extensions or simple API calls that summarize long BLS tables into bullet-point growth narratives. Example prompt: "Review these occupational projections and list the top five roles likely to see openings in the next eight weeks based on historical hiring patterns."
Users report faster identification of crossover skills, such as combining healthcare administration data with remote-work trends to surface hybrid roles. Always verify AI outputs against primary BLS tables to maintain accuracy and avoid over-reliance on generated text.
Analyzing Job Board Keyword Trends
Public job boards reveal real-time demand signals missing from slower BLS releases. Search volume tools on Indeed, Glassdoor, and LinkedIn provide free trend graphs for specific phrases. Record weekly counts for 20 target keywords and import them into the spreadsheet for correlation analysis. Rising mentions of "entry-level AI prompt engineer" alongside steady BLS growth for related computer occupations signal emerging opportunities.
Combine this with Google Trends comparisons across geographic regions to prioritize applications in high-activity metros. Sample weekly routine includes exporting trend data every Monday morning and updating the dashboard before reviewing new listings.
Comparing Free Versus Paid Data Sources
Free resources from BLS and O*NET deliver authoritative baseline projections updated on predictable schedules. Paid platforms often add proprietary scraping of job postings and sentiment analysis but introduce recurring costs. Most individual job seekers achieve strong results by sticking with public data and supplementing with manual trend checks. Transition to paid services only after mastering the free workflow and identifying specific gaps in coverage for specialized fields like advanced manufacturing.
Real Examples of Spotting High-Growth Roles
One user tracked BLS data on wind turbine technicians showing 60 percent projected growth and paired it with rising "wind energy maintenance" searches. This led to early applications that resulted in interviews two weeks before major companies posted positions publicly. Another example involved logistics analysts where combining e-commerce keyword spikes with BLS supply chain projections allowed targeted outreach in the Pacific Northwest region ahead of seasonal hiring waves.
A third case demonstrated success in education technology by monitoring "instructional designer" trends against BLS figures for training specialists, yielding multiple offers within a single quarter. These cases highlight the value of consistent data layering rather than isolated metrics.
Metrics to Track Predictor Accuracy
Effective evaluation relies on three core metrics tracked in a dedicated log tab. Hit rate measures the percentage of predicted roles that receive actual openings within a six-week window. Lead time calculates the average number of weeks between prediction and first posting. Application conversion rate tracks how many tailored applications from predicted roles result in interviews.
Review these numbers monthly by comparing logged entries against archived job board results. Adjust weighting factors in the scoring formula when hit rates fall below 55 percent. Over successive cycles, most users reach stable accuracy levels between 65 and 75 percent by refining data inputs and regional filters.
Practical Checklists for Implementation
- Download the most recent BLS employment projections file and verify column headers match your template.
- Select 15 occupations across two industries for initial testing based on growth thresholds.
- Establish a recurring calendar reminder for weekly keyword volume collection from three job boards.
- Document all formulas used in scoring to allow easy replication or sharing.
- Review one historical prediction per week to identify systematic biases in data weighting.
- Prepare three customized resume versions aligned with top-scoring roles before active applications begin.
FAQ: Turning Predictions into Targeted Applications
How do I validate a prediction before applying? Compare at least three independent signals including BLS growth, keyword volume change, and recent news mentions of company expansion in that sector.
What if accuracy is low initially? Reduce the number of tracked roles to five and increase update frequency to twice weekly until patterns stabilize.
Can this work for remote roles? Filter BLS data by occupation and overlay remote-specific keyword searches such as "remote" plus the job title to isolate distributed opportunities.
How often should I update the dashboard? Refresh trend data weekly and incorporate new BLS releases immediately upon publication, typically every two years for full projections.
Should I share my predictions publicly? Keep initial versions private until accuracy exceeds 70 percent to avoid spreading unverified signals.
Conclusion
Developing a personal 2026 job predictor using free labor data transforms reactive searching into strategic planning. The combination of BLS statistics, AI assistance, and keyword monitoring creates a repeatable system that improves over time. Begin with the spreadsheet foundation today and iterate based on measured results to gain consistent advantages in the evolving job market.

No comments yet. Be the first!