 Jobboy

Introduction
Internal talent marketplaces have become essential tools for organizations aiming to boost employee retention and close skill gaps efficiently. In 2026, HR leaders must move beyond anecdotal evidence and adopt rigorous measurement frameworks to demonstrate clear return on investment. This article explores practical quantification methods, key performance indicators, setup processes, benchmarks, and strategies to align marketplace success with broader business objectives. With employee mobility now a strategic priority, understanding how to calculate and communicate these impacts helps HR teams secure resources and drive organizational change.
Understanding Internal Talent Marketplaces
An internal talent marketplace is a digital platform that connects employees with internal opportunities such as projects, roles, and mentorship programs. Unlike traditional career ladders, these systems promote fluid mobility across departments and functions. By facilitating internal moves, companies reduce external hiring costs and improve engagement levels. In 2026, these platforms often integrate AI-driven matching to suggest opportunities based on skills, experience, and career aspirations. Benefits extend beyond retention to include faster skill development, higher employee satisfaction, and reduced time spent on external recruitment processes. Organizations that implement these marketplaces effectively see improved collaboration and a culture that values continuous growth rather than static job titles.
Key Performance Indicators for ROI Measurement
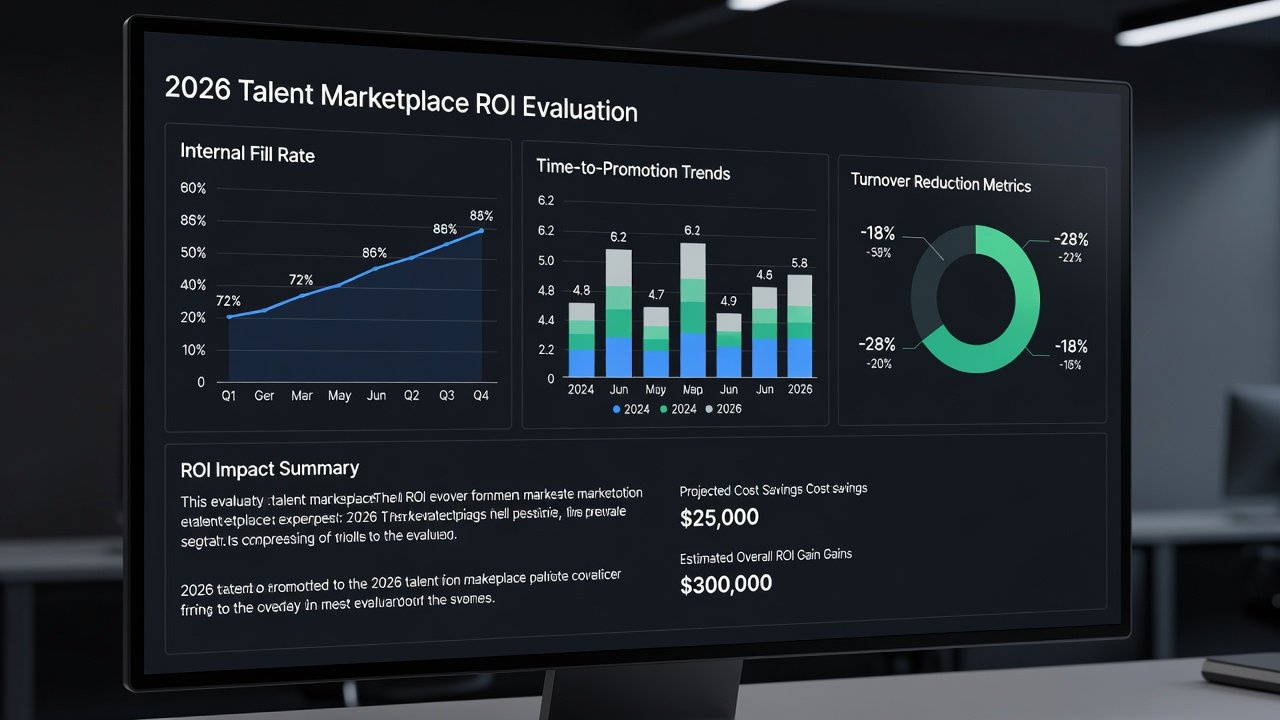
Effective evaluation starts with tracking specific KPIs. Internal fill rate measures the percentage of open positions filled by current employees. Calculate it as (internal hires / total hires) × 100. For example, if 45 out of 60 positions are filled internally in a quarter, the rate is 75 percent. A rising internal fill rate directly correlates with lower recruitment expenses and stronger retention. Time-to-promotion tracks the average months from hire or last advancement to the next role; reductions here signal marketplace effectiveness in accelerating careers. Turnover reduction compares pre- and post-implementation voluntary exit rates, often segmented by tenure or department.
Real-world calculation example: Suppose baseline annual turnover stands at 18 percent with an average replacement cost of $25,000 per employee for a 500-person workforce. After marketplace rollout, turnover drops to 12 percent, saving $300,000 annually. Retention impact ROI equals (turnover cost savings minus platform costs) divided by platform investment, expressed as a percentage. Additional mobility metrics include internal application volume, match success rates, and the percentage of employees participating in cross-functional projects. These indicators together provide a balanced view of both quantitative savings and qualitative improvements in workforce agility.
Setting Up Tracking with ATS and HRIS Data
Begin by integrating your applicant tracking system (ATS) and human resources information system (HRIS). Export fields like job postings, applicant sources, promotion dates, exit reasons, and skill inventories. Use APIs or ETL tools to create centralized dashboards that pull real-time data without manual intervention. Step 1 involves defining baseline metrics from the prior 12 months across all relevant departments. Step 2 requires tagging all internal applications, project assignments, and moves with consistent categories. Step 3 focuses on automating quarterly reports that highlight trends in fill rates, time-to-promotion, and turnover segments. Step 4 includes training HR analysts on interpreting the data and adjusting filters for SMB versus enterprise scales. This structured approach ensures data accuracy and repeatability while minimizing the need for additional software investments. Regular audits of data quality prevent discrepancies that could undermine credibility with leadership.
Benchmarks for SMBs Versus Enterprises
Small and medium businesses (SMBs) often achieve internal fill rates of 50-65 percent due to flatter organizational structures and fewer specialized roles, while enterprises target 70-85 percent thanks to larger internal talent pools and dedicated mobility programs. SMBs typically observe time-to-promotion reductions of 3-5 months within the first year of implementation. Enterprises commonly report 4-8 month reductions alongside broader adoption across global teams. Turnover reduction benchmarks average 15-25 percent for both segments once marketplaces reach maturity, though enterprises may sustain higher percentages through advanced analytics. SMBs benefit most from quick wins in engagement, whereas enterprises focus on scaling metrics across business units. Comparing your organization's performance against these ranges helps pinpoint areas for targeted improvement and realistic goal setting.
Common Pitfalls in Measurement
Avoid over-relying on vanity metrics such as total platform logins or page views, which fail to capture actual business outcomes. Instead, correlate platform activity directly with outcomes like skill gap closure rates and promotion velocity. Another frequent pitfall involves ignoring external factors such as economic shifts or industry-specific talent shortages that influence turnover independently of the marketplace. Ensure consistent data definitions across departments to prevent skewed results from varying interpretations of what constitutes an internal hire. Measurement fatigue can occur if too many KPIs are tracked simultaneously; prioritize three to five core metrics initially. Finally, failing to segment data by employee demographics or role type can mask important variations, such as higher retention gains among mid-level professionals compared to entry-level staff.
Tying Marketplace Success to Business Goals
Link retention improvements directly to strategic priorities such as innovation capacity and operational efficiency. For instance, if skill gap closure ranks as a top goal, measure the percentage of critical roles filled internally within targeted competencies over a 12-month period. Track how internal mobility reduces time-to-productivity for new assignments and contributes to project completion rates. This connection helps secure ongoing investment by demonstrating clear contributions to revenue stability and reduced operational disruptions. Organizations can further align efforts by setting marketplace objectives that mirror annual business plans, such as increasing the proportion of leadership roles filled from within by 20 percent. Regular alignment reviews between HR and executive teams ensure metrics remain relevant to evolving company needs.
Practical Implementation Tips and Expanded Examples
Start with a pilot program in one department to refine tracking processes before company-wide rollout. Use existing ATS reports to establish a control group for comparison. In one mid-sized technology firm, implementing a marketplace led to a 22 percent increase in internal applications and a 9 percent drop in voluntary turnover within nine months. Another enterprise example involved linking marketplace participation to performance reviews, resulting in measurable skill development across 1,200 employees. Incorporate employee feedback surveys to complement quantitative data and identify usability improvements. These layered approaches create robust evidence for ROI discussions.
Conclusion
By implementing these measurement practices, HR teams can confidently showcase the value of internal talent marketplaces throughout 2026 and beyond. Consistent tracking, thoughtful benchmarking, and strategic alignment transform raw data into compelling narratives that support talent retention and business growth.
FAQ
How can leadership buy-in be secured?
Present a pilot ROI analysis using existing ATS data to show projected savings from reduced turnover and faster internal mobility, supplemented by employee satisfaction scores.
What is the recommended reporting cadence?
Monthly dashboards for operational teams and quarterly executive summaries provide the right balance of detail and strategic overview, allowing timely adjustments.
How should skill gap closure be quantified?
Map marketplace assignments against predefined competency frameworks and track the percentage of gaps addressed through internal moves each quarter.
What role does employee feedback play in ROI assessment?
Surveys on perceived career opportunities complement hard metrics and reveal qualitative retention drivers not captured in turnover statistics alone.
Additional authoritative resources include guidance from SHRM, workforce data from U.S. Department of Labor, and labor statistics at Bureau of Labor Statistics.

No comments yet. Be the first!