 Jobboy

Introduction
In today's competitive job market, a data-driven approach can transform how you search for roles. By tracking applications, analyzing response rates, and refining your targeting, you can identify what works and eliminate ineffective tactics. This guide walks through practical analytics techniques tailored for 2026, helping efficiency-focused beginners and intermediates achieve measurable improvements. Job seekers who apply analytics often reduce wasted effort on mismatched listings and accelerate their path to interviews by focusing on proven patterns rather than random submissions.
Why Analytics Matters in Job Searching
Traditional job searches often rely on intuition, leading to wasted effort on mismatched listings. Analytics brings clarity by revealing patterns in application outcomes. For instance, you might discover that applications sent on weekdays yield higher interview rates than those submitted on weekends. This insight allows you to allocate time more strategically, focusing on high-impact activities. Without data, many candidates repeat the same mistakes across dozens of applications, but with tracking you gain visibility into variables like timing, source quality, and role alignment that directly influence success rates.
Key Metrics to Track
Start with core metrics that provide actionable insights. Application volume shows overall effort. Response rate, calculated as interviews divided by applications, highlights targeting effectiveness. Aim for an application-to-interview ratio between 10:1 and 15:1 as a benchmark for improvement. Additional metrics include time-to-response measured in average days from submission to first reply, source performance comparing job boards versus company career pages, and role match score where you rate each listing on relevance from 1 to 10 based on your skills and experience.
- Application-to-interview ratio: Track weekly to spot trends and adjust volume.
- Time-to-response: Monitor averages to identify responsive employers.
- Source performance: Compare job boards versus company sites for conversion quality.
- Role match score: Rate each listing on relevance from 1 to 10 to prioritize future searches.
- Rejection reason categories: Log common feedback themes to guide resume tweaks.
These metrics help compare strategies like broad searches (high volume, lower ratios) versus niche targeting (fewer applications, higher conversion). Documenting them consistently builds a reliable dataset over time.
Setting Up Simple Dashboards with Free Tools
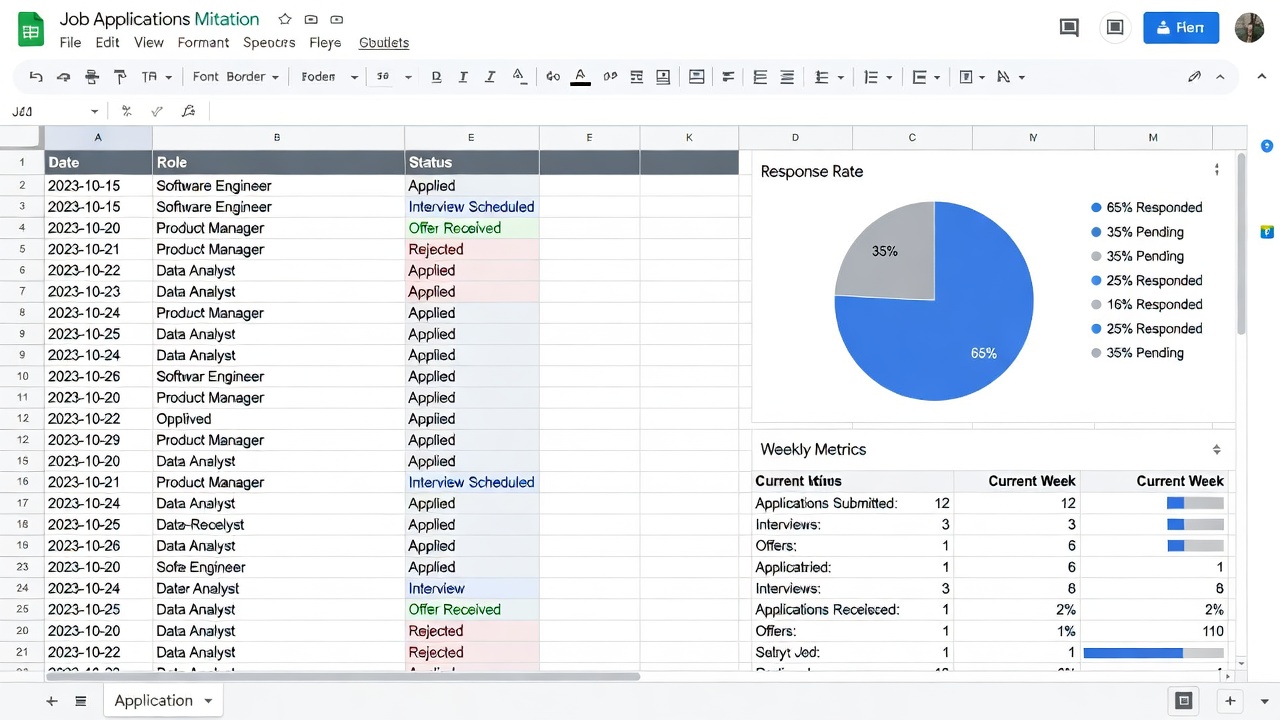
Free tools in 2026 make dashboard creation straightforward. Google Sheets offers templates for logging applications with columns for date, source, role, status, and notes. Microsoft Excel Online provides similar functionality with built-in charts. Notion databases allow integration of notes alongside metrics for a more holistic view.
Follow these steps to build your dashboard:
- Create a new spreadsheet and label columns: Date Applied, Job Title, Company, Source, Status, Response Date, Interview Date, Notes, Match Score.
- Enter data immediately after each application submission to avoid recall errors.
- Use formulas like =COUNTIF for totals and =AVERAGE for response times to automate calculations.
- Generate charts for visual trends, such as response rates by source or weekly application volume.
- Set up conditional formatting to highlight high-performing sources in green and low ones in red.
- Review weekly to adjust your approach based on emerging patterns.
Beginners should start with Google Sheets due to its accessibility and collaboration features, then progress to more advanced formulas in Excel as comfort grows.
Comparing Broad vs. Niche Search Strategies
Broad searches cast a wide net across industries, increasing volume but often lowering response quality. Niche searches focus on specific roles or sectors, improving match rates. Use your dashboard to test both: run a broad campaign for two weeks, then switch to niche for comparison. Data typically shows niche approaches improve interview ratios by 20-30% for targeted candidates. For example, a software developer testing broad applications across tech and finance saw a 12:1 ratio, while narrowing to fintech roles alone achieved an 8:1 ratio within the same timeframe, demonstrating the value of focused targeting informed by initial metrics.
Interpreting Job Listing Patterns
Analyze listings for recurring keywords, salary ranges, and requirements. Tools like BLS.gov provide labor market data to contextualize trends. If listings emphasize remote skills, update your resume accordingly. Real-world example: A marketing professional noticed "SEO" appearing in 70% of desired roles, leading to targeted upskilling and a 40% rise in interview invites. Cross-reference patterns with O*NET Online to understand evolving occupational demands and align your applications more precisely with employer expectations.
Avoiding Common Data Pitfalls
Common errors include inconsistent data entry, ignoring external factors like economic shifts, and over-relying on small sample sizes. Always log entries immediately and cross-reference with sources like Census.gov for market context. Example pitfall: A job seeker miscalculated ratios by excluding rejections, skewing results—correct logging fixed this. Another frequent issue is failing to account for seasonal hiring fluctuations, which can distort monthly comparisons unless normalized across multiple quarters of data collection.
Conducting Effective Weekly Reviews
Schedule a dedicated 30-minute review each Sunday evening. During this session, calculate updated ratios, identify top-performing sources, and note any trends in rejection reasons. Adjust the following week's application targets based on these findings, such as increasing submissions to high-conversion boards or pausing underperforming ones. This iterative process turns raw data into continuous strategy refinement.
Integrating Analytics with Networking
Analytics should complement rather than replace human connections. Track networking events or informational interviews in your dashboard alongside formal applications. For instance, note how many referrals lead to interviews compared to cold applications. This combined view often reveals that referred applications convert at rates two to three times higher than direct submissions, guiding you to prioritize relationship-building alongside data tracking.
Tool Comparison Table
| Tool | Best For | Key Features | Limitations |
|---|---|---|---|
| Google Sheets | Beginners | Free, collaborative, charts | Basic automation only |
| Excel Online | Advanced users | Formulas, pivot tables | Requires Microsoft account |
| Notion | Integrated notes | Databases, templates | Learning curve for new users |
FAQ
How do I protect my data privacy when tracking applications?
Use anonymized entries and secure cloud tools with two-factor authentication. Review privacy policies of platforms like Google Sheets before storing sensitive details.
What if my sample size is too small?
Continue tracking for at least 50 applications before drawing conclusions to ensure statistical reliability and avoid premature strategy changes.
Can analytics replace networking?
No, combine data insights with networking for optimal results since personal referrals frequently outperform purely metric-driven applications.
How often should I update my dashboard?
Log entries daily and perform full analysis weekly to maintain accurate, timely insights without overwhelming administrative burden.
Conclusion
Implementing analytics in your job search empowers smarter decisions and faster progress. By consistently measuring and refining, you'll optimize outcomes in 2026 and beyond while building habits that support long-term career growth.

No comments yet. Be the first!