 Jobboy
Introduction: Why Big Data Matters for 2026 Job Seekers
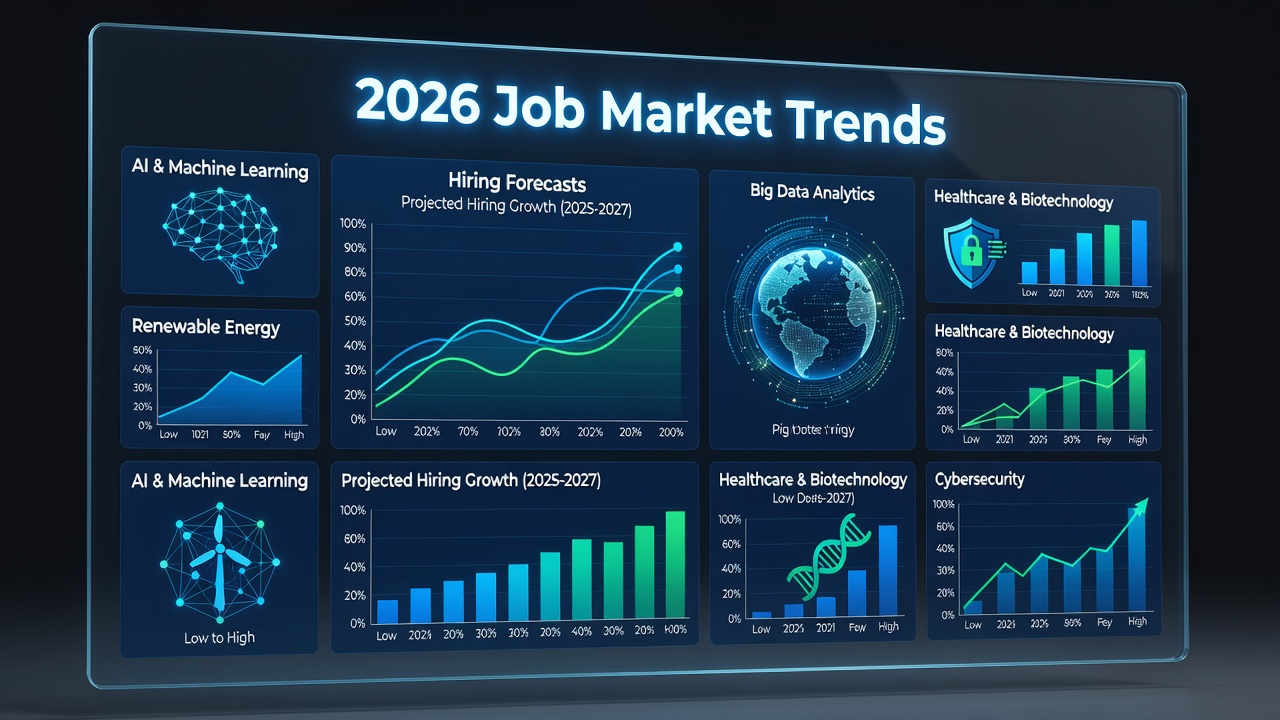
In a rapidly evolving employment landscape, traditional job search methods often fall short. Big data analytics empowers seekers to move beyond guesswork by analyzing vast labor market information to predict emerging opportunities. This approach helps target roles in high-growth sectors before competition intensifies. By 2026, industries like AI, renewable energy, and healthcare tech are expected to drive significant hiring shifts, making data-driven foresight essential for anyone serious about career advancement.
Understanding patterns in employment data allows proactive skill development and targeted applications. Job seekers who master these techniques can identify roles with projected 15-25% growth rates in emerging fields while competitors rely on outdated assumptions. This guide covers sourcing reliable datasets, visualization techniques, indicator interpretation, and model building, along with comparisons and real examples to give you a complete toolkit for success.
Sourcing Public Labor Market Datasets
Start with authoritative public sources to gather raw data that forms the foundation of any predictive effort. The Bureau of Labor Statistics provides monthly employment reports, occupational outlooks, and industry-specific statistics that cover thousands of job categories. Complement this with data from U.S. Census Bureau for demographic and regional employment trends that reveal geographic hotspots. Additional free repositories include Data.gov for aggregated federal datasets on workforce development and training programs.
Focus on variables like job openings, hiring rates, and unemployment by occupation. Download CSV files covering the past five years to establish baselines and seasonal patterns. Always verify data freshness, as quarterly updates from these sources reflect the most recent economic conditions. Cross-reference with international sources if targeting global roles, ensuring your dataset includes both national aggregates and state-level breakdowns for precision.
Using Free Visualization Tools for Pattern Spotting
Once data is collected, visualization reveals trends invisible in spreadsheets. Tools like Google Charts, Tableau Public, and Microsoft Power BI offer free tiers for creating interactive charts. Import labor statistics to plot line graphs showing growth in sectors such as software development or nursing over time, allowing you to spot acceleration points early.
For beginners, start with bar charts comparing skill demand across regions. Heat maps can highlight geographic hotspots for remote-friendly roles. Experiment with filters to isolate spikes in postings during economic recoveries. These visuals help quickly identify where demand is accelerating toward 2026 projections. Practice by layering multiple datasets, such as combining BLS occupational data with census migration figures, to uncover correlations like rising demand for remote tech roles in mid-sized cities.
Interpreting Indicators Like Industry Growth and Skill Demand
Key metrics include year-over-year job growth rates and skill frequency in postings. Rising percentages in green energy occupations, for instance, signal expanding opportunities that may double in certain regions. Track education requirements and certifications to align your profile with emerging needs, paying special attention to micro-credentials gaining traction.
Cross-reference multiple indicators to avoid false signals. A temporary surge in one metric may not sustain without supporting data from adjacent sectors. Combine BLS growth projections with real-time aggregator insights for balanced forecasts. Create a personal dashboard tracking at least five core indicators: job opening rates, median wage changes, education requirements, geographic distribution, and skill keyword frequency.
- Monitor BLS monthly job openings and labor turnover survey for real-time hiring velocity.
- Analyze occupational employment statistics to project five-year growth trajectories.
- Review skill inventories from public job boards to detect emerging demand spikes in tools like Python or cloud platforms.
- Factor in macroeconomic indicators such as GDP growth by sector for context.
Building Simple Predictive Models: Step-by-Step Examples
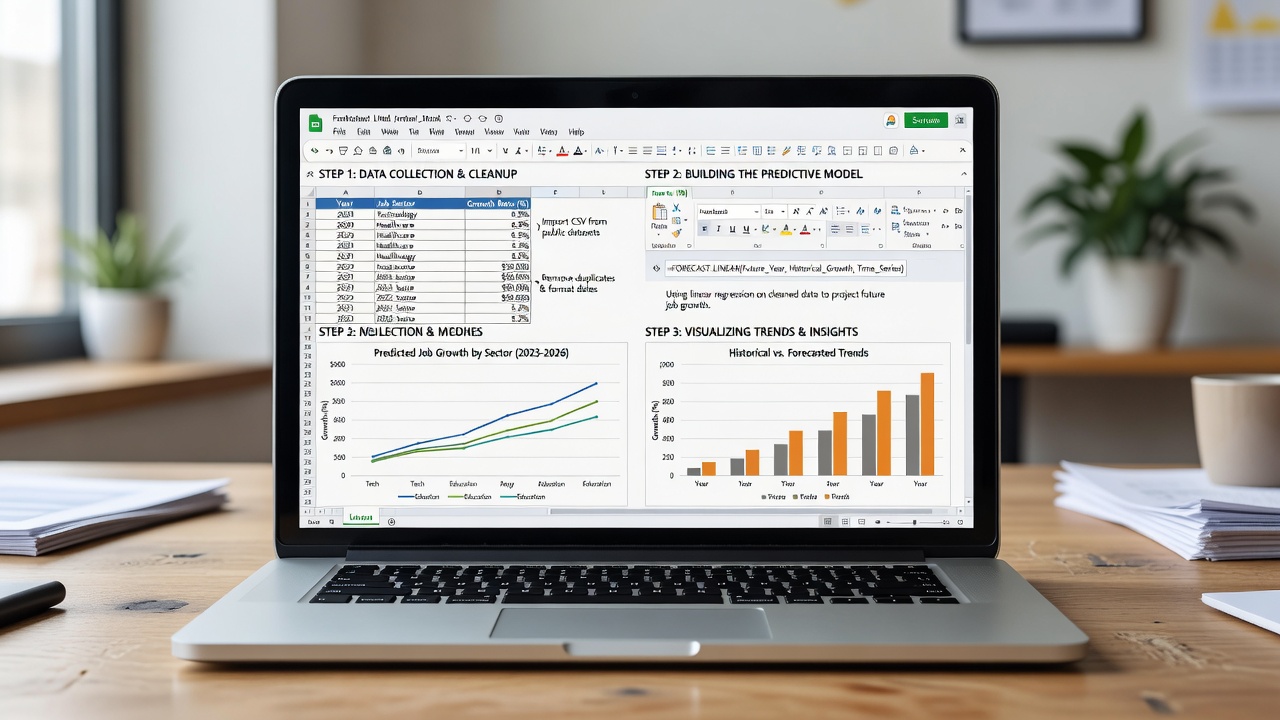
Creating basic predictive models requires no advanced coding. Use spreadsheet software like Google Sheets or Excel for regression analysis. Step 1: Compile historical data on job openings from the past 36 months. Step 2: Calculate average growth rates and standard deviations. Step 3: Apply linear regression formulas to extrapolate 2026 estimates while testing for seasonality.
For example, if healthcare support roles grew 8% annually over three years, project forward using trend lines and adjust for variables like aging population demographics. Add economic indicators such as unemployment rates for improved accuracy. Validate models against recent actuals to refine assumptions. Free Python libraries such as scikit-learn on platforms like Google Colab enable more sophisticated time-series forecasting when ready to advance. Test your model by backcasting known 2024 data and measuring prediction error rates below 10% before applying to future years.
Government Stats Versus Private Aggregator Data
Government sources like BLS deliver comprehensive, unbiased statistics with broad coverage but lag by weeks or months. Private aggregators such as Indeed or LinkedIn provide near-real-time posting volumes and skill trends, though they may reflect platform biases toward certain industries. Compare both for robust insights: use government data for long-term projections and private data for immediate demand signals in specific metro areas.
This dual approach mitigates gaps, ensuring strategies account for both macroeconomic shifts and granular, current openings. Government data excels in standardized occupational classifications, while private sources offer granular keyword analysis useful for resume optimization.
Real-World Case Studies of Successful Adjustments
Consider a marketing professional who analyzed BLS data showing digital analytics roles surging 22% year-over-year. By upskilling in data visualization tools through free online courses, they secured a 2025 role in a growing e-commerce firm ahead of peers and negotiated a 15% higher starting salary. Another case involved a software engineer reviewing regional Census data indicating migration to sustainable tech hubs. Relocating to an emerging tech hub allowed them to land a position in renewable energy software before widespread demand peaked, resulting in faster promotion tracks.
A third example features a recent graduate who combined public labor data with skill demand visualizations to pivot from general business to supply chain analytics. This targeted approach led to three interviews within two months and a role in logistics technology supporting 2026 growth projections in e-commerce fulfillment.
Potential Pitfalls and Ethical Data Use
Common errors include over-relying on single datasets or ignoring context like seasonal fluctuations and economic shocks. Ensure models incorporate multiple variables to improve reliability. Ethically, respect data privacy by using only anonymized public information and avoid scraping proprietary sites without permission. Limitations in accuracy arise from unforeseen events such as policy changes; always treat predictions as directional guides rather than certainties. Regularly update datasets quarterly to maintain relevance and test assumptions against new releases from official sources.
FAQ on Ethical Data Use and Accuracy Limitations
How accurate are big data job predictions?
Predictions offer strong directional guidance but carry inherent uncertainty due to economic variables. Cross-validation with multiple sources improves reliability to within 10-15% error margins for most sectors.
Is it ethical to use public datasets for personal job strategies?
Yes, when sourced from open government repositories and used responsibly without misrepresenting findings or violating terms of service from data providers.
What free tools are best for beginners?
Google Sheets combined with public BLS downloads provides an accessible starting point for visualization and basic modeling before advancing to Python environments.
Can big data replace networking in job searches?
No, it complements networking by informing which connections and conversations to prioritize based on emerging trends and regional opportunities.
How often should I update my predictive models?
Refresh models quarterly using the latest BLS and Census releases to capture shifts from events like policy changes or technological breakthroughs.
Conclusion: Taking Action on Data Insights
By integrating big data techniques into your job search, you position yourself ahead of market curves for 2026. Start small with public datasets, build visualizations, and iterate on simple models while staying mindful of ethical practices. The candidates who succeed are those who treat data as a continuous compass rather than a one-time exercise, adjusting strategies as new information emerges.


No comments yet. Be the first!