 Jobboy
Introduction: Turning Data into Your 2026 Job Advantage
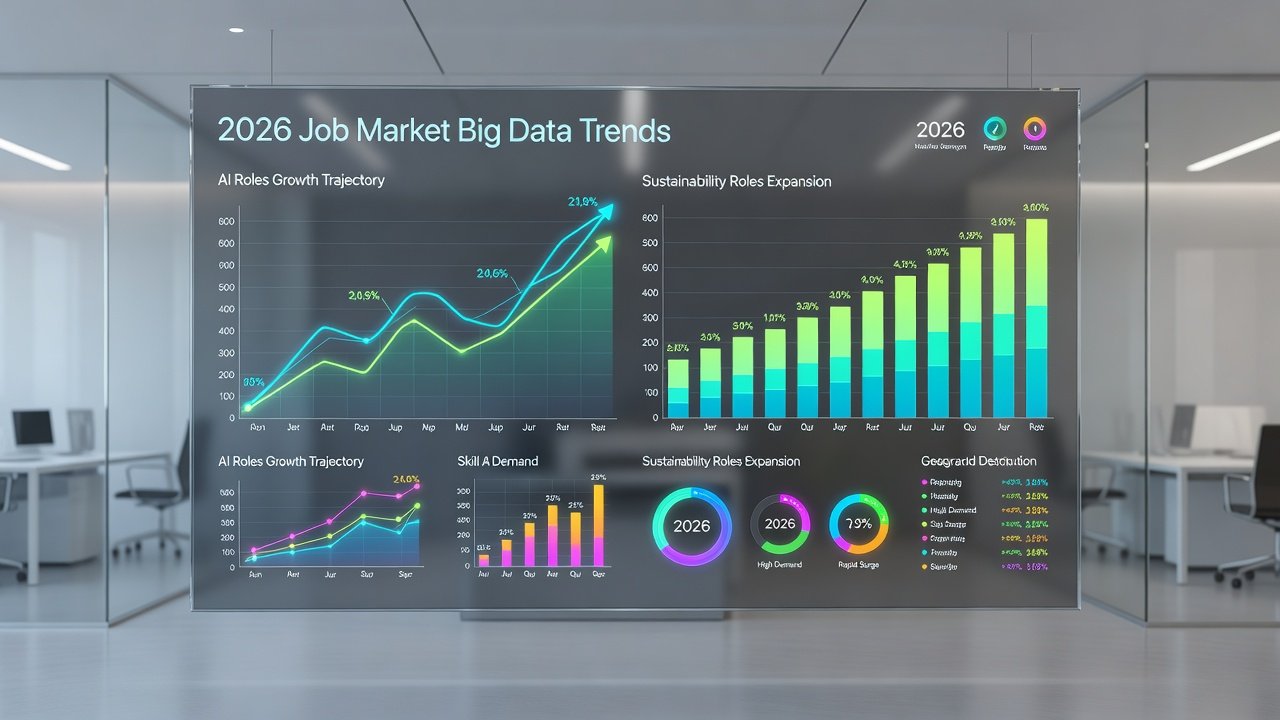
Job seekers who leverage big data can identify emerging roles before they flood the market. This playbook shows exactly how to source statistics, scrape keywords intelligently, and build personal trend dashboards to predict openings in high-growth fields like AI ethics and sustainable tech. By following these steps, you will convert raw insights into focused applications that stand out in 2026. In today’s competitive landscape, relying solely on job alerts or networking leaves you reactive. Instead, proactive data analysis empowers you to anticipate demand shifts, align your skills in advance, and submit applications at the optimal moment when competition remains lower.
Why Big Data Forecasting Matters for Job Seekers
Traditional job searches rely on intuition or general trends. Big data changes that by revealing patterns in hiring velocity, skill demand, and geographic shifts. For instance, analyzing historical postings can highlight roles growing faster than average, giving you weeks or months to upskill and apply early. Beyond speed, this approach reduces wasted effort on saturated fields and highlights niche opportunities in emerging sectors such as quantum computing support or climate data modeling. Professionals who adopted similar methods in prior years reported higher interview rates because their applications arrived when hiring managers first posted roles. The method also builds long-term career resilience by teaching you to monitor labor market signals continuously rather than during active searches.
Sourcing Free Labor Statistics
Start with government and public databases that provide reliable, no-cost data. The U.S. Bureau of Labor Statistics offers monthly employment reports and occupational projections. Download datasets on employment by industry and cross-reference with skill requirements. Supplement with U.S. Census Bureau tools for regional labor force data. These sources update frequently, so set calendar reminders to pull fresh files every two weeks. Additionally, explore the O*NET Online database maintained by the U.S. Department of Labor for detailed occupational skill profiles and emerging task lists. To extract maximum value, filter datasets by education level, experience requirements, and wage percentiles. Create a simple tracking log noting the date of each download and any notable percentage changes in employment numbers for your target occupations. This habit ensures your forecasts remain grounded in authoritative, unbiased information rather than anecdotal reports.
AI Keyword Scraping from Job Boards
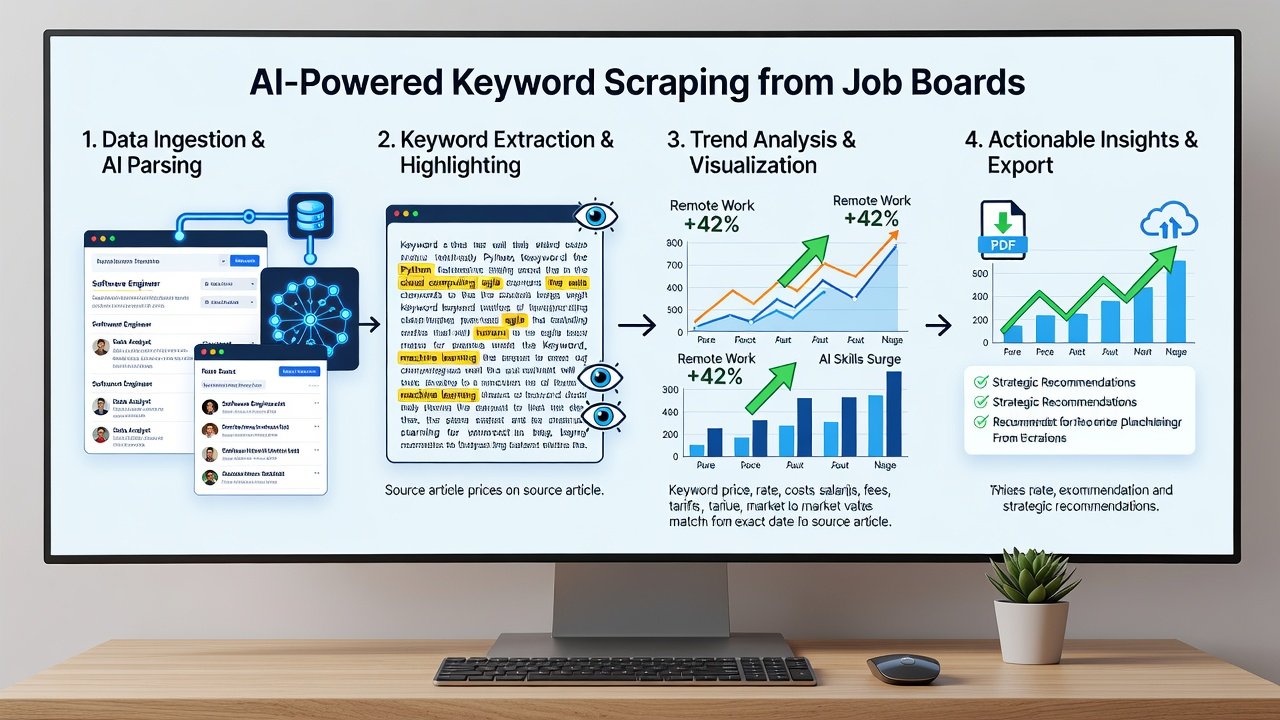
Next, automate keyword extraction from major job boards using free or low-code AI tools. Tools like Python with BeautifulSoup or simple browser extensions powered by open models can scrape postings for terms such as “machine learning operations” or “data governance.” Focus on frequency spikes over 30-day windows. Always respect robots.txt and rate limits to stay compliant. Example: scrape Indeed and LinkedIn weekly, then feed results into a spreadsheet that flags terms appearing 25% more than the prior period. To deepen this process, categorize scraped keywords into primary skills, secondary tools, and soft attributes. Run sentiment analysis on job descriptions using free natural language processing libraries to gauge whether employers emphasize innovation or compliance. Document any new terminology that appears consistently across multiple companies, as these often signal the birth of standardized roles. For users without coding experience, no-code platforms with AI scraping templates allow similar results through point-and-click interfaces while still exporting structured CSV files for further analysis.
Building Simple Trend Dashboards
Combine the above data into a personal dashboard using free tools like Google Sheets or Tableau Public. Create columns for date, role title, location, required skills, and posting volume. Add formulas to calculate growth rates and visualize with line charts. Update the dashboard bi-weekly to spot acceleration in fields like cybersecurity analytics or green energy data science. Begin by importing your scraped CSV files and BLS exports into a master sheet. Use pivot tables to summarize posting counts by skill cluster and geographic region. Add conditional formatting to highlight cells where growth exceeds 15 percent month-over-month. For visual appeal, embed sparkline charts directly in rows so you can scan trends at a glance without switching tabs. Advanced users can connect the sheet to free APIs from public data portals for semi-automated refreshes. The key is simplicity: limit your dashboard to eight core metrics so it remains actionable rather than overwhelming.
Real Examples of Predicting Openings in Emerging Fields
In late 2025, analysts noticed a sharp rise in “prompt engineer” mentions across postings. Those who tracked the trend applied early to 2026 roles in generative AI teams. Similarly, monitoring “sustainability data analyst” postings predicted openings in ESG reporting teams at Fortune 500 companies. Another case involved “edge computing specialist” roles, where dashboard alerts flagged a doubling of listings in the Midwest within six weeks. Job seekers who prepared portfolios demonstrating relevant projects landed interviews within days of the first major postings. These examples illustrate the power of combining multiple data streams: government projections provided the macro view while real-time scraping supplied the micro timing advantage. Replicate the process by selecting three target roles, running parallel tracking for each, and maintaining a weekly summary document that records both predictions and actual outcomes.
Comparison Table of Data Sources
| Source | Update Frequency | Best For | Limitations |
|---|---|---|---|
| BLS.gov | Monthly | National growth projections | Less granular on skills |
| Census.gov | Quarterly | Regional demographics | Broader industry focus |
| O*NET Online | Annual with updates | Skill and task details | Slower refresh cycle |
| Job board APIs | Daily | Real-time skill trends | Requires scraping setup |
Actionable Checklists for Implementation
- Week 1: Set up BLS and Census data downloads and create a master spreadsheet with columns for all key variables.
- Week 2: Configure AI scraping scripts for three job boards, log at least 100 postings, and categorize keywords.
- Week 3: Build initial dashboard with growth-rate formulas, pivot tables, and conditional formatting rules.
- Week 4: Identify top three emerging roles, research required skills, and begin targeted applications with customized materials.
- Week 5: Review dashboard accuracy against real postings and refine keyword filters based on outcomes.
- Week 6: Expand tracking to include competitor company hiring pages and industry association job boards.
Metric-Tracking Tips to Stay Focused
Track application conversion rates, skill gap closure timelines, and dashboard accuracy against actual job postings. Review metrics monthly and adjust keywords if prediction hit rates fall below 60%. Avoid data overload by limiting sources to five core feeds and automating alerts for threshold changes. Additional tips include setting up email notifications for specific metric thresholds and maintaining a separate “insights log” where you record qualitative observations that numbers alone cannot capture. For example, note when a role title evolves from “data analyst” to “AI data strategist” because this linguistic shift often precedes salary band adjustments and new responsibility areas. Regularly compare your dashboard predictions against published industry reports to validate methodology and build confidence in your forecasts over time.
Short FAQ on Avoiding Data Overload
How many data sources should I monitor?
Stick to three to five authoritative feeds to maintain quality without overwhelm while still capturing diverse signals.
What if trends contradict each other?
Weight government statistics higher than single job boards and look for convergence across multiple indicators before acting.
How often should I update my dashboard?
Bi-weekly updates strike the best balance between freshness and effort for most job seekers.
Should I share my dashboard publicly?
Keep it private initially; once refined, consider sharing anonymized versions in professional communities for feedback.
What tools help automate alerts?
Google Sheets notifications or free versions of data visualization platforms can send threshold-based emails without extra cost.
Conclusion: Apply Insights to Land 2026 Roles
Big data forecasting turns passive job hunting into proactive strategy. By mastering free statistics, smart scraping, and personal dashboards, you position yourself ahead of the curve. Start today with one checklist item and watch your targeted applications yield stronger results throughout 2026. The habits developed now will continue serving your career long after the initial search concludes, turning market intelligence into a lifelong professional asset.

No comments yet. Be the first!