 Jobboy

Introduction
Mid-level professionals in 2026 face a dynamic job market where intuition alone often falls short. Data analytics provides a structured way to assess opportunities, align skills with demand, and execute pivots with confidence. This guide walks through sourcing reliable information, selecting tools, building personal dashboards, and running comparisons to support evidence-based decisions that align with emerging growth areas.
Many professionals rely on gut feelings or anecdotal advice when considering a career change, but this approach can lead to misaligned moves. By contrast, using labor market statistics, skill trend analysis, and scenario modeling allows individuals to quantify risks and rewards. The result is a clearer path toward roles that match both personal strengths and market realities in 2026.
Sourcing Reliable Career and Labor Market Data
Start with government and established databases for accurate, up-to-date insights. The Bureau of Labor Statistics offers occupational outlooks, wage data, and employment projections that update regularly. Supplement with O*NET Online for detailed skill requirements across roles. Cross-reference with U.S. Census Bureau reports on industry shifts to identify emerging sectors.
Focus on 2026-relevant trends such as AI integration, green energy transitions, and remote work evolution. Filter data by location, experience level, and education to match your profile. Additional sources include state-level workforce agencies and industry associations that publish sector-specific forecasts. Always verify the publication date of each dataset to ensure relevance.
Selecting Analytics Tools for Career Planning
Choose accessible platforms that handle spreadsheets, visualization, and basic statistical modeling. Google Sheets or Microsoft Excel suffice for beginners with built-in charts and pivot tables that support quick filtering and summary statistics. Advance to Tableau Public or Power BI for interactive dashboards that allow drill-down into specific metrics. Python with libraries like Pandas and Matplotlib enables custom analysis for those comfortable with code, while R provides strong statistical capabilities for trend testing.
Prioritize free or low-barrier options initially, then scale as needed. Consider mobile accessibility if you plan to review data during commutes or travel. Test each tool with a small sample of your own career data before committing to a full dashboard build.
Building Your Personal Career Dashboard
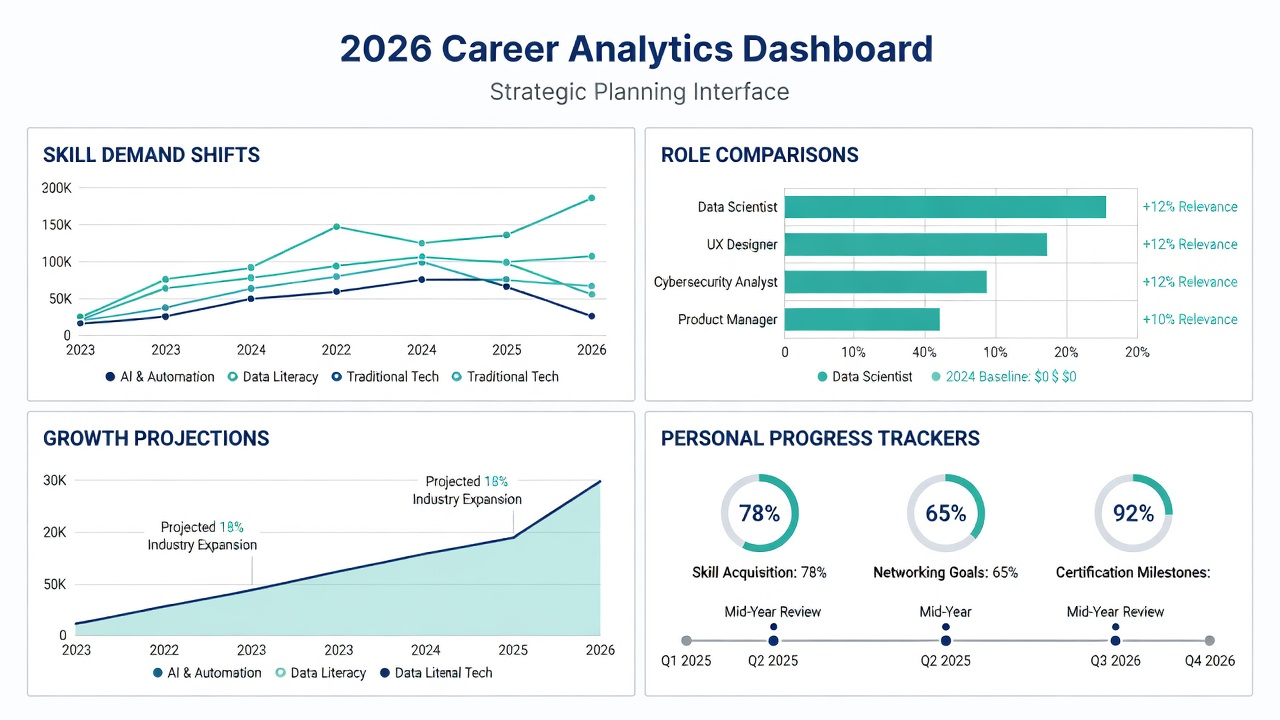
A dashboard centralizes key metrics for ongoing monitoring. Include columns for target roles, required skills, salary ranges, growth projections, and personal skill gaps. Update quarterly using fresh data pulls. Add sections for networking contacts, certification deadlines, and application tracking to create a holistic view.
Populate with sources from BLS and O*NET. Add filters for industry and location. Visualize demand shifts with bar charts and track progress via simple line graphs showing skill acquisition over time. Include conditional formatting to highlight roles where your current skills meet at least 70 percent of requirements. This visual cue helps prioritize development efforts efficiently.
Running Scenario Comparisons Between Roles or Industries
Compare options side-by-side. Create tables listing two or three target positions with metrics like projected openings, median compensation trends, remote flexibility, and skill overlap percentages. Run sensitivity analysis by adjusting variables such as relocation or additional certifications. This reveals trade-offs clearly, such as higher growth potential in tech versus stability in healthcare.
Document assumptions for each scenario so you can revisit them later. For example, note whether projections assume continued economic expansion or account for potential downturns. Use simple formulas to calculate weighted scores based on your personal priorities, such as work-life balance versus advancement speed.
Interpreting Trends Like Skill Demand Shifts
Analyze data for patterns in emerging competencies. Look for rising mentions of data literacy, cybersecurity basics, and sustainability knowledge across job postings. Use trend lines from labor reports to forecast 2026 opportunities. Avoid overreacting to short-term fluctuations by examining three-to-five-year trajectories.
Break down broad trends into actionable sub-skills. For instance, instead of noting “AI knowledge,” identify specific tools like prompt engineering or model evaluation that appear repeatedly. Cross-check these against your own experience to determine quick wins versus longer-term learning investments.
Real-World Examples from Diverse Sectors
A marketing manager in consumer goods used BLS data to pivot into digital analytics for healthcare, identifying a strong growth area in patient data roles. An engineer in manufacturing built a dashboard comparing automotive and renewable energy positions, leading to a transition with targeted upskilling in solar technology. A finance professional in banking analyzed remote-work trends and successfully moved into fintech compliance, using O*NET skill mappings to highlight transferable regulatory expertise.
These cases highlight how structured analysis uncovers hidden alignments. Each individual began with publicly available datasets, built iterative dashboards, and validated insights through conversations with professionals already in the target fields.
Step-by-Step Implementation Guide
- Define your current skills inventory and career goals in writing.
- Pull baseline data from BLS and O*NET for three target roles.
- Set up a spreadsheet dashboard with core metrics and filters.
- Run monthly updates and scenario tests with sensitivity variables.
- Validate findings with informational interviews and additional sources.
- Execute the pivot with tracked milestones and quarterly reviews.
- Document lessons learned to refine future analyses.
Avoiding Common Data Pitfalls
Watch for outdated datasets or biased samples from single sources. Always triangulate information across multiple outlets. Ignore small sample sizes in niche fields and account for regional variations. Do not let correlation imply causation when reviewing skill-demand links. Another frequent error is overlooking qualitative factors such as company culture or advancement pathways that numbers alone cannot capture.
Regularly audit your dashboard for data freshness and remove metrics that no longer align with your evolving goals. Seek feedback from mentors or career coaches on your interpretation methods to catch blind spots early.
FAQ
Are these tools accessible without advanced technical skills?
Yes, most professionals start with spreadsheet software and free public datasets before advancing to visualization platforms.
How often should dashboards be updated?
Review quarterly or after major economic reports to stay aligned with 2026 shifts.
Can this approach work across industries?
Absolutely, the framework adapts to tech, finance, education, and more by swapping in sector-specific data sources.
What if my target role has limited public data?
Combine available statistics with job posting analysis and professional association reports to build a more complete picture.
Conclusion
Data analytics transforms career pivots from guesswork into strategic moves. By consistently applying these methods, mid-level professionals position themselves for 2026 growth opportunities with clarity and measurable progress. The combination of reliable data sources, thoughtful tool selection, and disciplined dashboard maintenance creates a repeatable process that supports long-term career resilience.


No comments yet. Be the first!